Docs / AI Agent
Reporting
Get insights about your customer support and AI Agent performance.
How it works
The Reporting page gives you a clear view of your customer support performance. You can open it from the main navigation menu, and all metrics adjust automatically when you change the date range using the selector at the top.
What data is shown
Top three metrics
Time to First Reply (TTFR) shows the average time from when a thread is created to the first reply. The value is displayed in hours and reflects the selected date range.
Time to Reply (TTR) is the average time between replies in a conversation. It also displays hours and updates based on the chosen date range.
Time from Report to Implementation shows how long it takes from the moment a request is reported until it is implemented, measured in hours for the selected period.
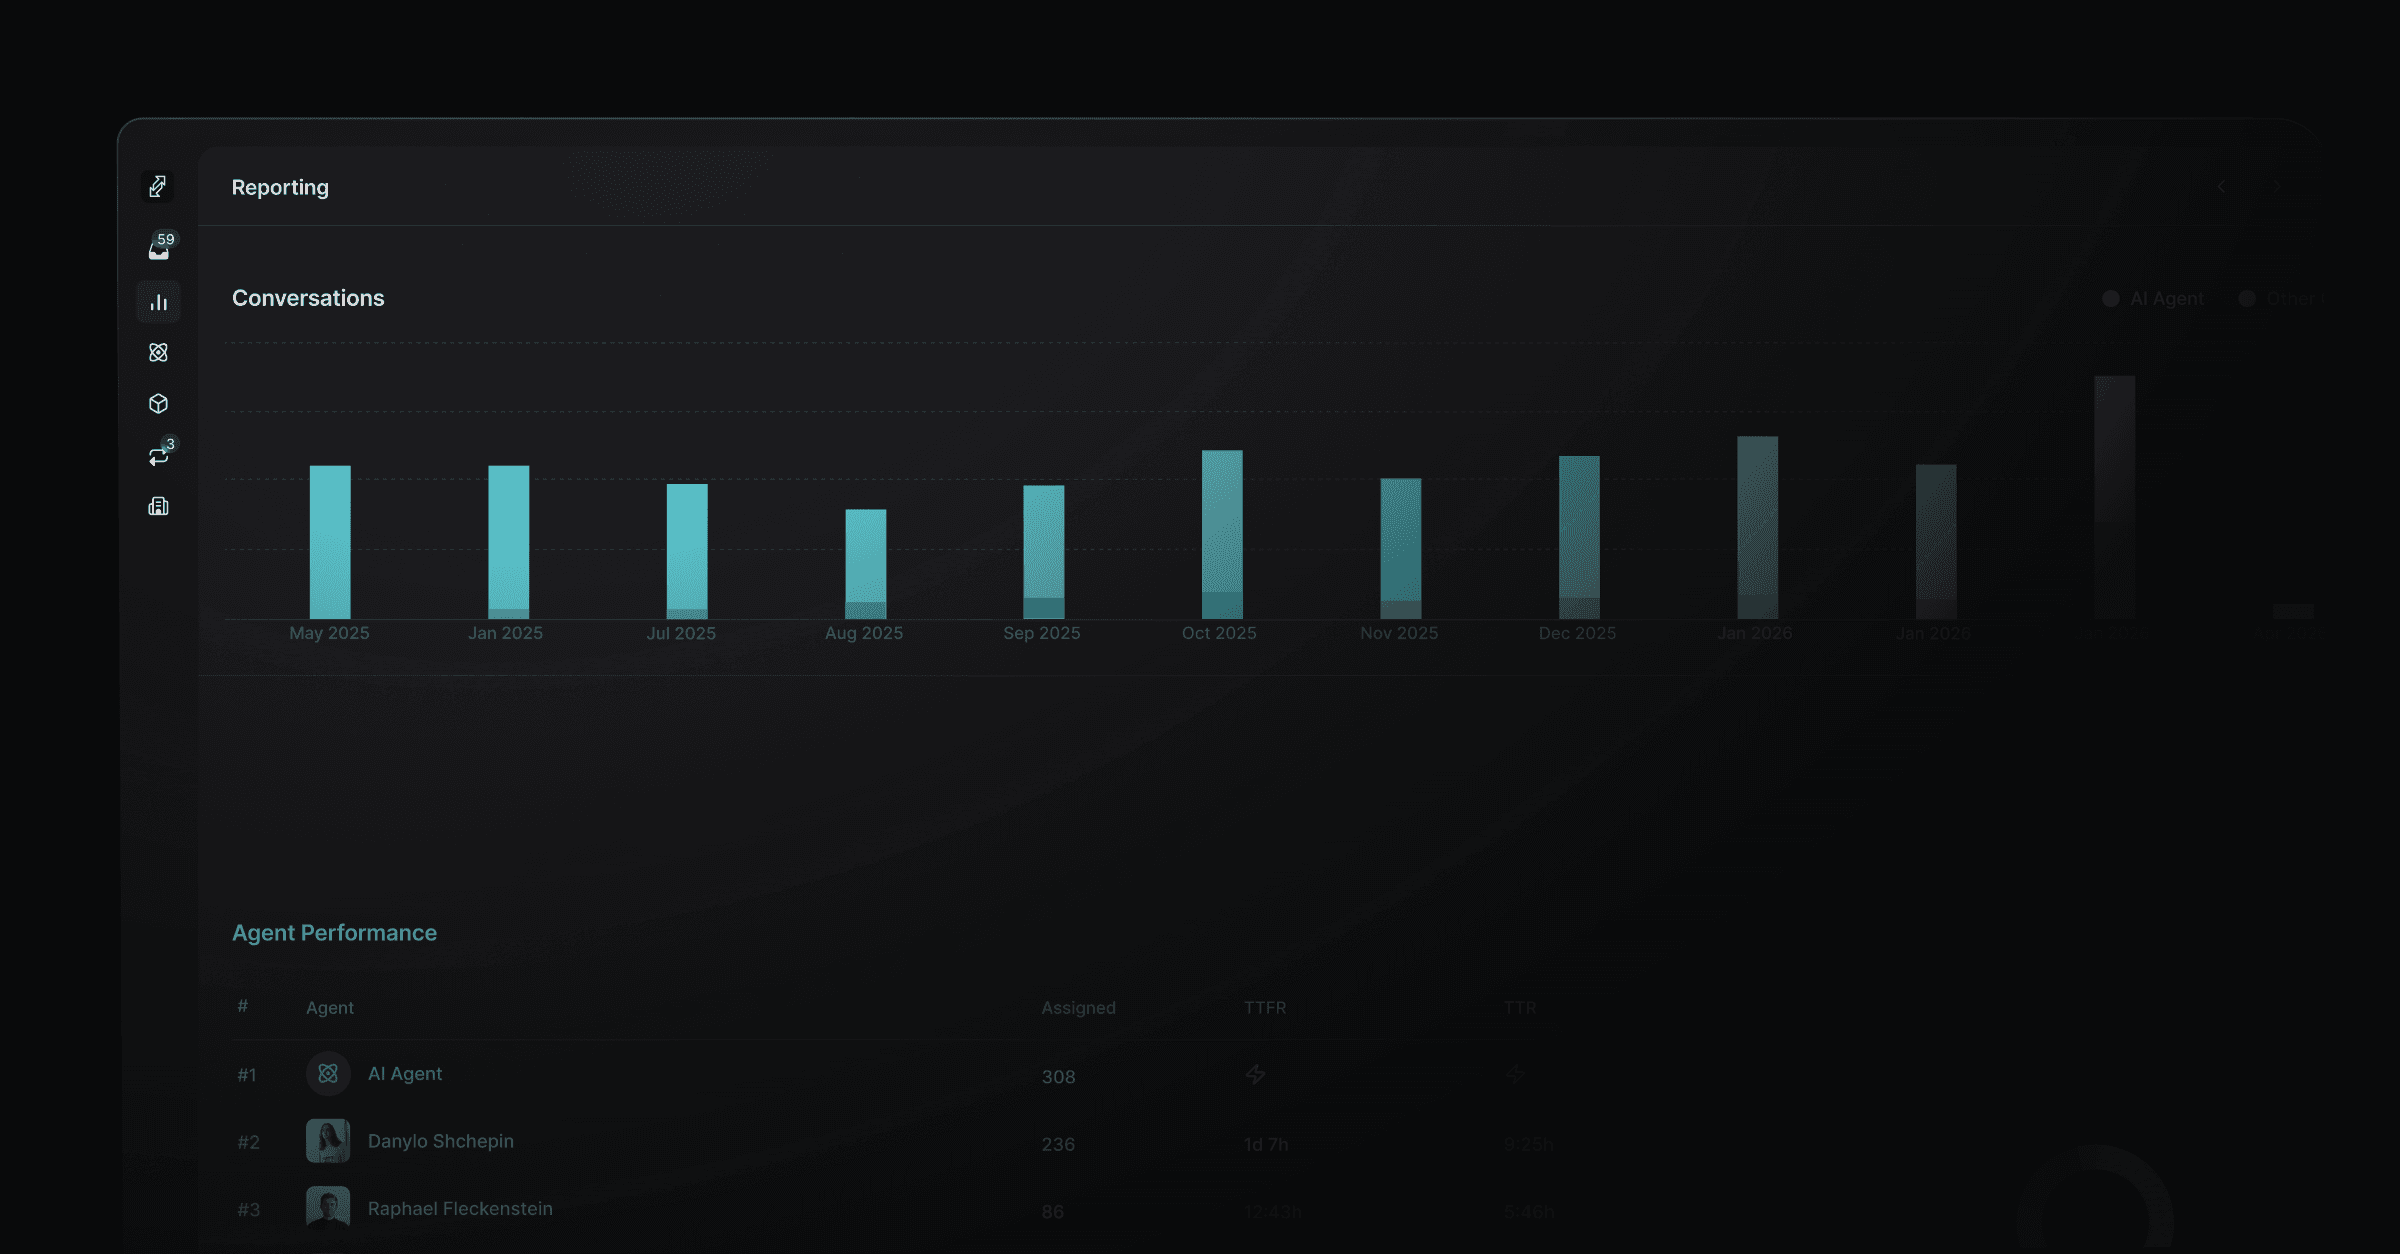
Conversations chart
The chart visualizes monthly conversation volume with a bar graph covering the past 12 months. It also shows the share of AI Agent conversations compared to other sources like email, Slack, and the widget. Pipeline metrics highlight the number of new, responded (snoozed), and resolved (processed) threads.
Agent Performance
The agent table lists each team member along with their assigned thread count, Time to First Reply (TTFR), and Time to Reply (TTR). The AI Agent appears as its own entry with its assigned thread volume. A donut chart shows the distribution of threads across agents, and the list is sorted by number of assigned threads for easier comparison.
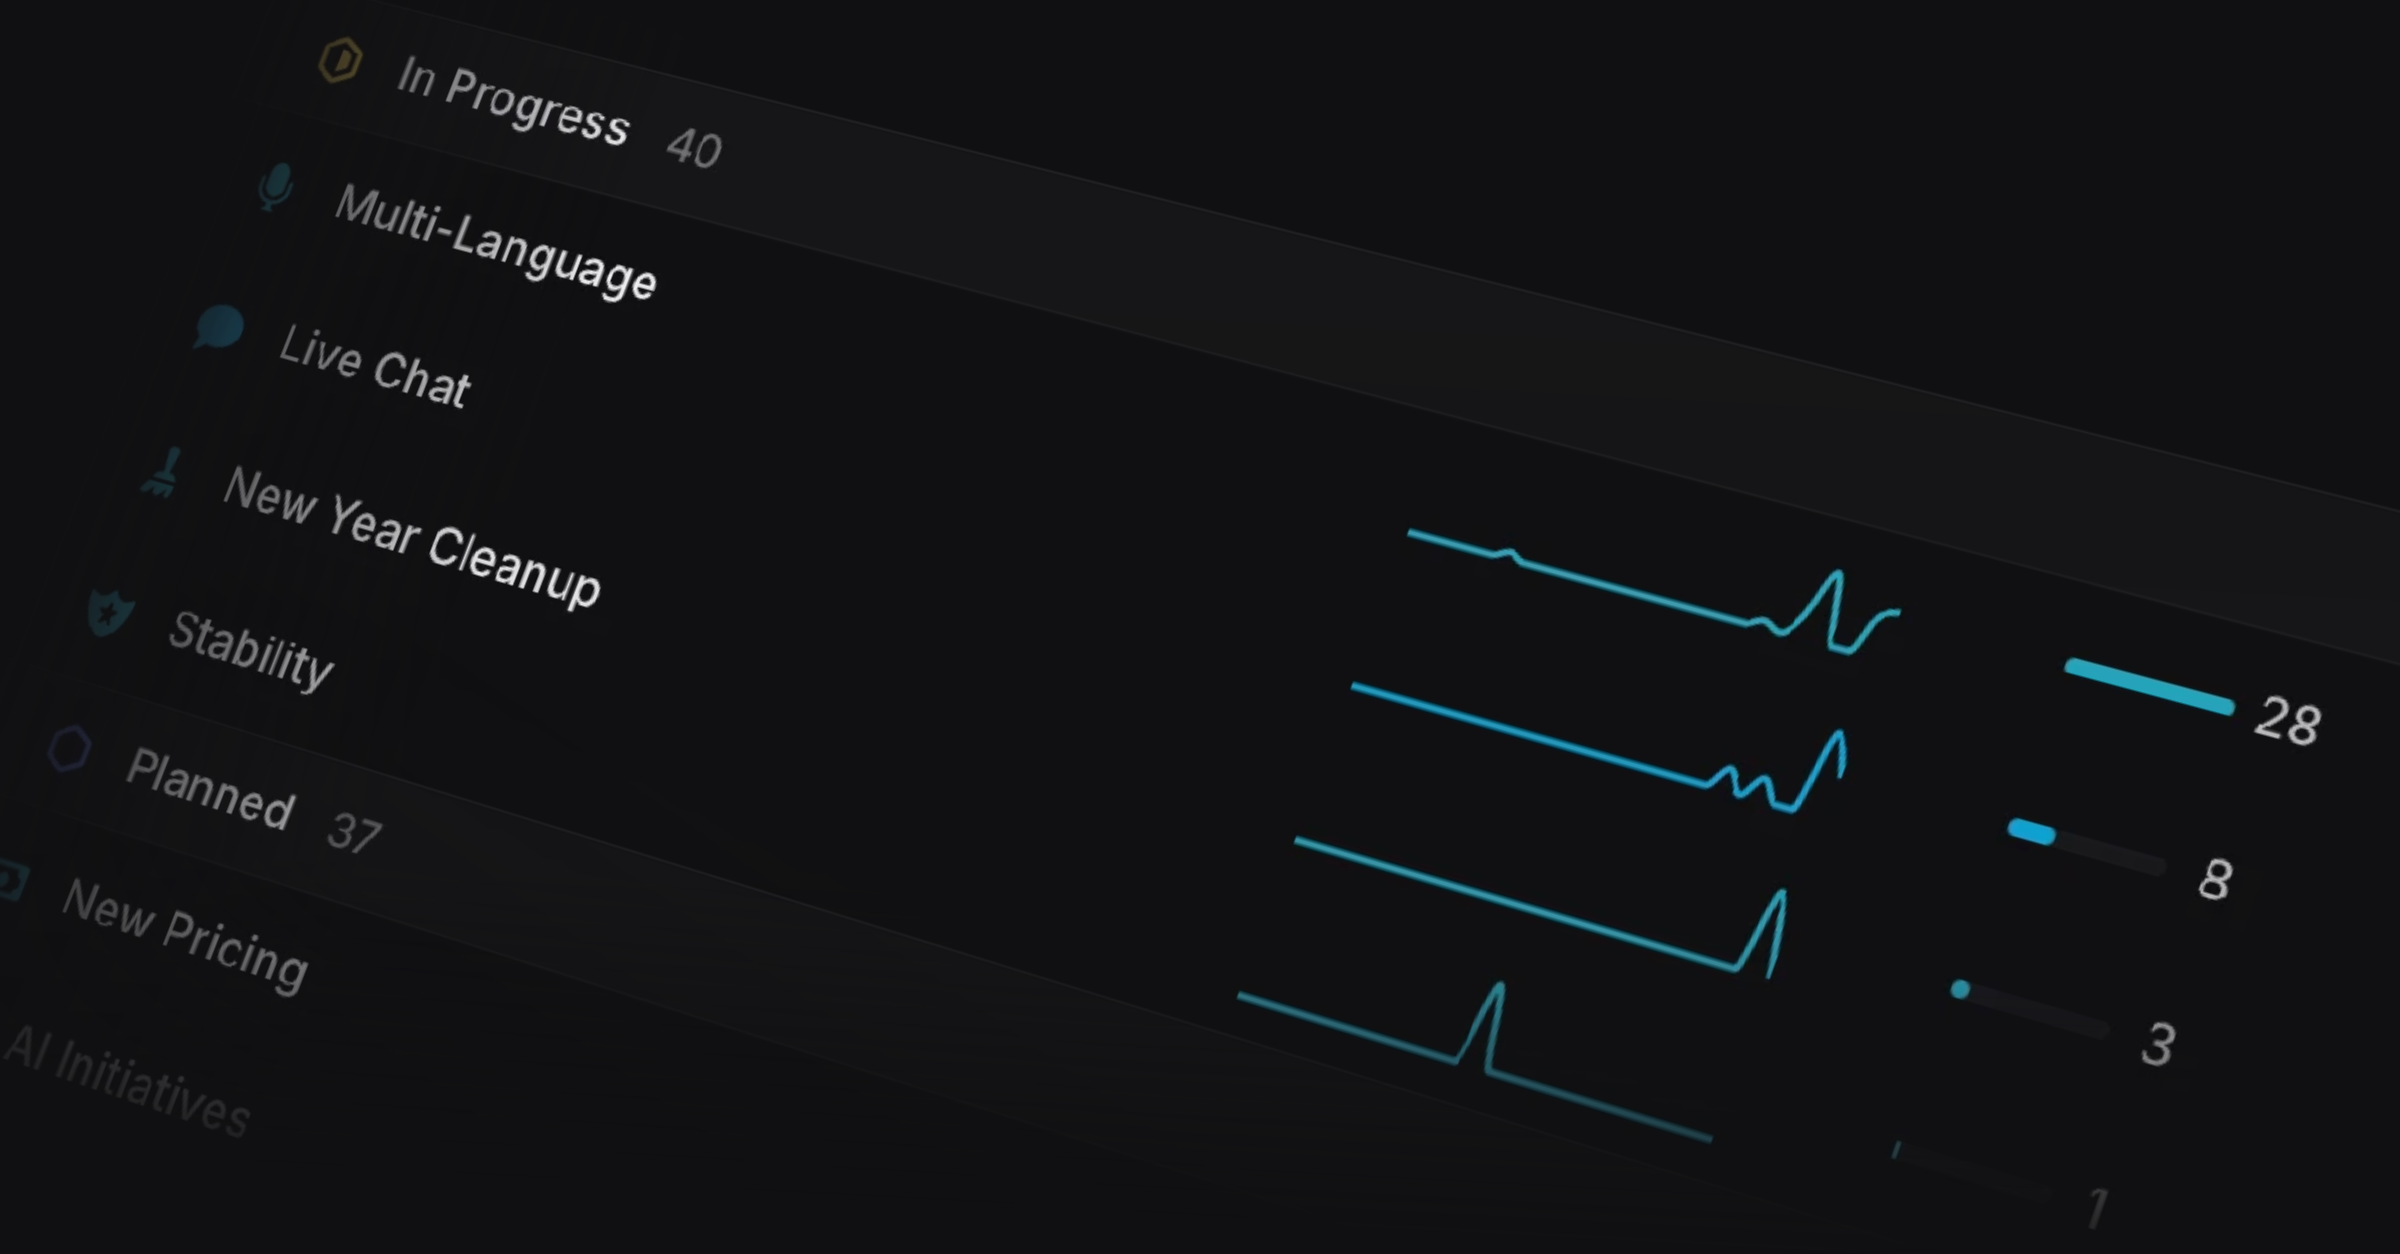
Tags Visualization
Tag groups are displayed with color coding, and each tag includes its name, icon, a feedback volume chart over time, a pain level indicator, and a total pain level score. Tags within each group are sorted by volume to highlight the most common issues.
All data respects the selected date range, which defaults to the last four weeks. The page updates instantly whenever you change the date range.
Customer Request Reporting
You can now view customer requests for Linear projects and issues over time, to see which requests come up every week versus what spiked recently. This even works for customer requests not created in Productlane, just hit CMD+K → Sync Linear to bring them all over.
Was this helpful?